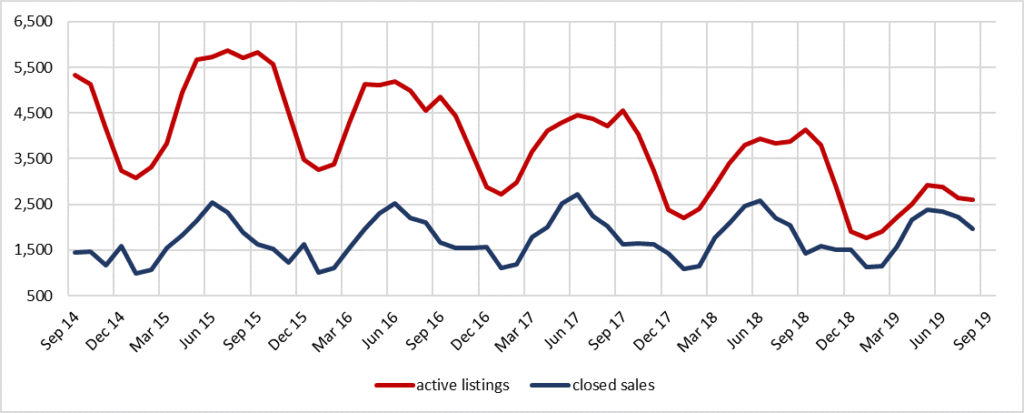
Across the board we are seeing trends of increasing prices and decreasing inventory almost everywhere. I found this chart from the Northern Virginia Association of Realtors to provide an interested representation of the tightening market on noVA. As they describe it, “graphing the trending five- year decline in end-of-month active listings compared against relatively stable monthly housing sales, it’s possible to visualize the compression”:

Source: Bright MLS stats calculated by NVAR. NVAR covers Arlington County, Fairfax County, City of Fairfax, City of Falls Church, Town of Vienna, and City of Alexandria.
In Loudoun County, end-month median sales price of $495,000 reflects a new 10-year record high for the month of October. Closed sales set a 10-year record high in Loudoun County at 538 in the month of October. This reflects a year-over-year increase in home sales of 15.2% since 2018.
Maryland is seeing similar trends with inventory down 9% and prices up 7% from last year….
Check out your local area below:
| Median Price | Change since last year % | Sales | Change since last year | Active Inventory | Change since last year | Days On Market | Change since last year | |
| Alexandria VA | $599,500 | 12% | 220 | -1% | 235 | -48% | 11 | -66% |
| Arlington County VA | $580,000 | 4% | 213 | -9% | 266 | -51% | 19 | -39% |
| Clarke County VA | $368,372 | -14% | 19 | -5% | 82 | 11% | 32 | -35% |
| Fairfax City VA | $550,000 | -8% | 25 | -26% | 59 | -19% | 28 | -32% |
| Fairfax County VA | $535,000 | 11% | 1258 | 9% | 2034 | -31% | 28 | -20% |
| Falls Church City VA | $745,000 | -9% | 15 | 0% | 9 | -78% | 28 | 22% |
| Fauquier County VA | $410,000 | 1% | 103 | 23% | 364 | -11% | 49 | -4% |
| Federick County VA | $250,000 | 0% | 123 | -16% | 446 | -16% | 42 | 5% |
| King George County VA | $259,450 | -12% | 38 | 58% | 123 | -15% | 41 | -28% |
| Loudoun County VA | $498,900 | 3% | 548 | 5% | 930 | -19% | 30 | -6% |
| Manassass City VA | $335,000 | 9% | 63 | 24% | 83 | -18% | 25 | -11% |
| Manassass Park City VA | $316,950 | 6% | 26 | 44% | 33 | -11% | 28 | 180% |
| Prince William County VA | $370,000 | 4% | 595 | 7% | 898 | -35% | 29 | -19% |
| Stafford County VA | $366,338 | 9% | 184 | -1% | 572 | -25% | 43 | 0% |
| Warren County VA | $231,000 | -4% | 67 | 10% | 215 | -19% | 54 | 23% |
| Berkeley County WV | 195850` | 7% | 240 | 28% | 735 | 6% | 47 | -16% |
| Jefferson County WV | $253,600 | -1% | 99 | 43% | 268 | -14% | 64 | -15% |
| Morgan County WV | $173,000 | -5% | 24 | 9% | 164 | -3% | 106 | 36% |
| Frederick County MD | $309,990 | 0% | 355 | 3% | 1104 | -10% | 41 | -16% |
| Montgomery County MD | $439,400 | 3% | 1051 | 10% | 2290 | -17% | 35 | -3% |
| Washington DC | $575,000 | -1% | 783 | -7% | 1910 | -7% | 25 | -14% |
Do you have any real estate questions or needs?
If so, you can email me directly at sian@sianpugh.comL


Leave a Reply